Diese Seite wird in nächster Zeit ausgebaut.
Auch für die Hard- und Software habe ich noch Todos auf meiner Liste – mehr Fehlertoleranz, Gehäuse usw.
Die entstandenen Produkte sind nicht für eine Serienproduktion geeignet, man muss fast überall Hand anlegen – sei es für die Hinterlegung des WLAN-Passworts.
Hardware
Die Daten für die Anzeige beziehe ich von einem SMA Sunny Tripower 4.0, eingebaut Juni 2019.
Ich habe 3 Anzeigen im Einsatz:

Dann läuft noch ein Webserver, den ich mit meiner Synology NAS realisiere.
Software
Webserver-Komponente
Die Daten werden durch das Script get_pv_data.php gesammelt und aufbereitet.
<?php


$url= "https://ip-adresse-wechselrichter/dyn/getDashValues.json";
$urlLogger = "https://ip-adresse-wechselrichter/dyn/getDashLogger.json";

$arrContextOptions=array(
		"ssl"=>array(
				"verify_peer"=>false,
				"verify_peer_name"=>false,
		),
);

$response = file_get_contents($url, false, stream_context_create($arrContextOptions));
$obj = json_decode($response,true);

$responseLogger = file_get_contents($urlLogger, false, stream_context_create($arrContextOptions));
$logger = json_decode($responseLogger,true);


$zaehlerStart = $logger["result"]["017A-xxxxxxxx"]["7020"][1][1]["v"];

$actPower    = $obj['result']['017A-xxxxxxxx']['6100_40263F00']['1'][0]['val'];
$actToGrid   = $obj['result']['017A-xxxxxxxx']['6100_40463600']['1'][0]['val'];
$actFromGrid = $obj['result']['017A-xxxxxxxx']['6100_40463700']['1'][0]['val'];
$actZaehler  = $obj['result']['017A-xxxxxxxx']['6400_00260100']['1'][0]['val'];

if (is_null($actPower)) {
	$actPower = 0;
}

if ($actPower==0) {
	$actUsage = $actFromGrid;
} elseif ($actPower>0 && $actFromGrid >0) {
	$actUsage=$actPower + $actFromGrid;
} elseif ($actPower >0 && $actToGrid > 0) {
	$actUsage = $actPower - $actToGrid;
} elseif ($actPower>0 && $actFromGrid==0 && $actToGrid==0) {
	$actUsage = $actPower;
}
if (is_null($zaehlerStart)) {
	$sumUsage = 0;
} elseif (is_null($actZaehler)) {
	$sumUsage = 0;
}else {
	$sumUsage = $actZaehler - $zaehlerStart;
}

$pvData = array(
		"pv"=>$actPower,
		"use"=>$actUsage,
		"in"=>$actFromGrid,
		"out"=>$actToGrid,
		"sum"=>$sumUsage,
);

echo json_encode($pvData);

?>
Dieses PHP-Script liefert folgende Ausgabe im JSON-Format:
{"pv":1544,"use":672,"in":0,"out":872,"sum":2466}| pv | Aktuelle Leistung |
| use | Aktueller Verbrauch des Haushalts (berechnet) |
| in | Aktueller Bezug aus dem öffentlichen Netz |
| out | Aktuelle Lieferung ins öffentliche Netz |
| sum | bisheriger Tagesertrag |
Die Daten verarbeite ich in den jeweiligen Programmen zur Anzeige.
Nach einem Firmware-Update des Wechselrichters kann es durchaus passieren, dass die Key-Werte im JSON-Datensatz anders sind. Hier ist dann wieder reverse engineering angesagt, die Pfade durch die JSON-Daten müssen dann angepasst werden.
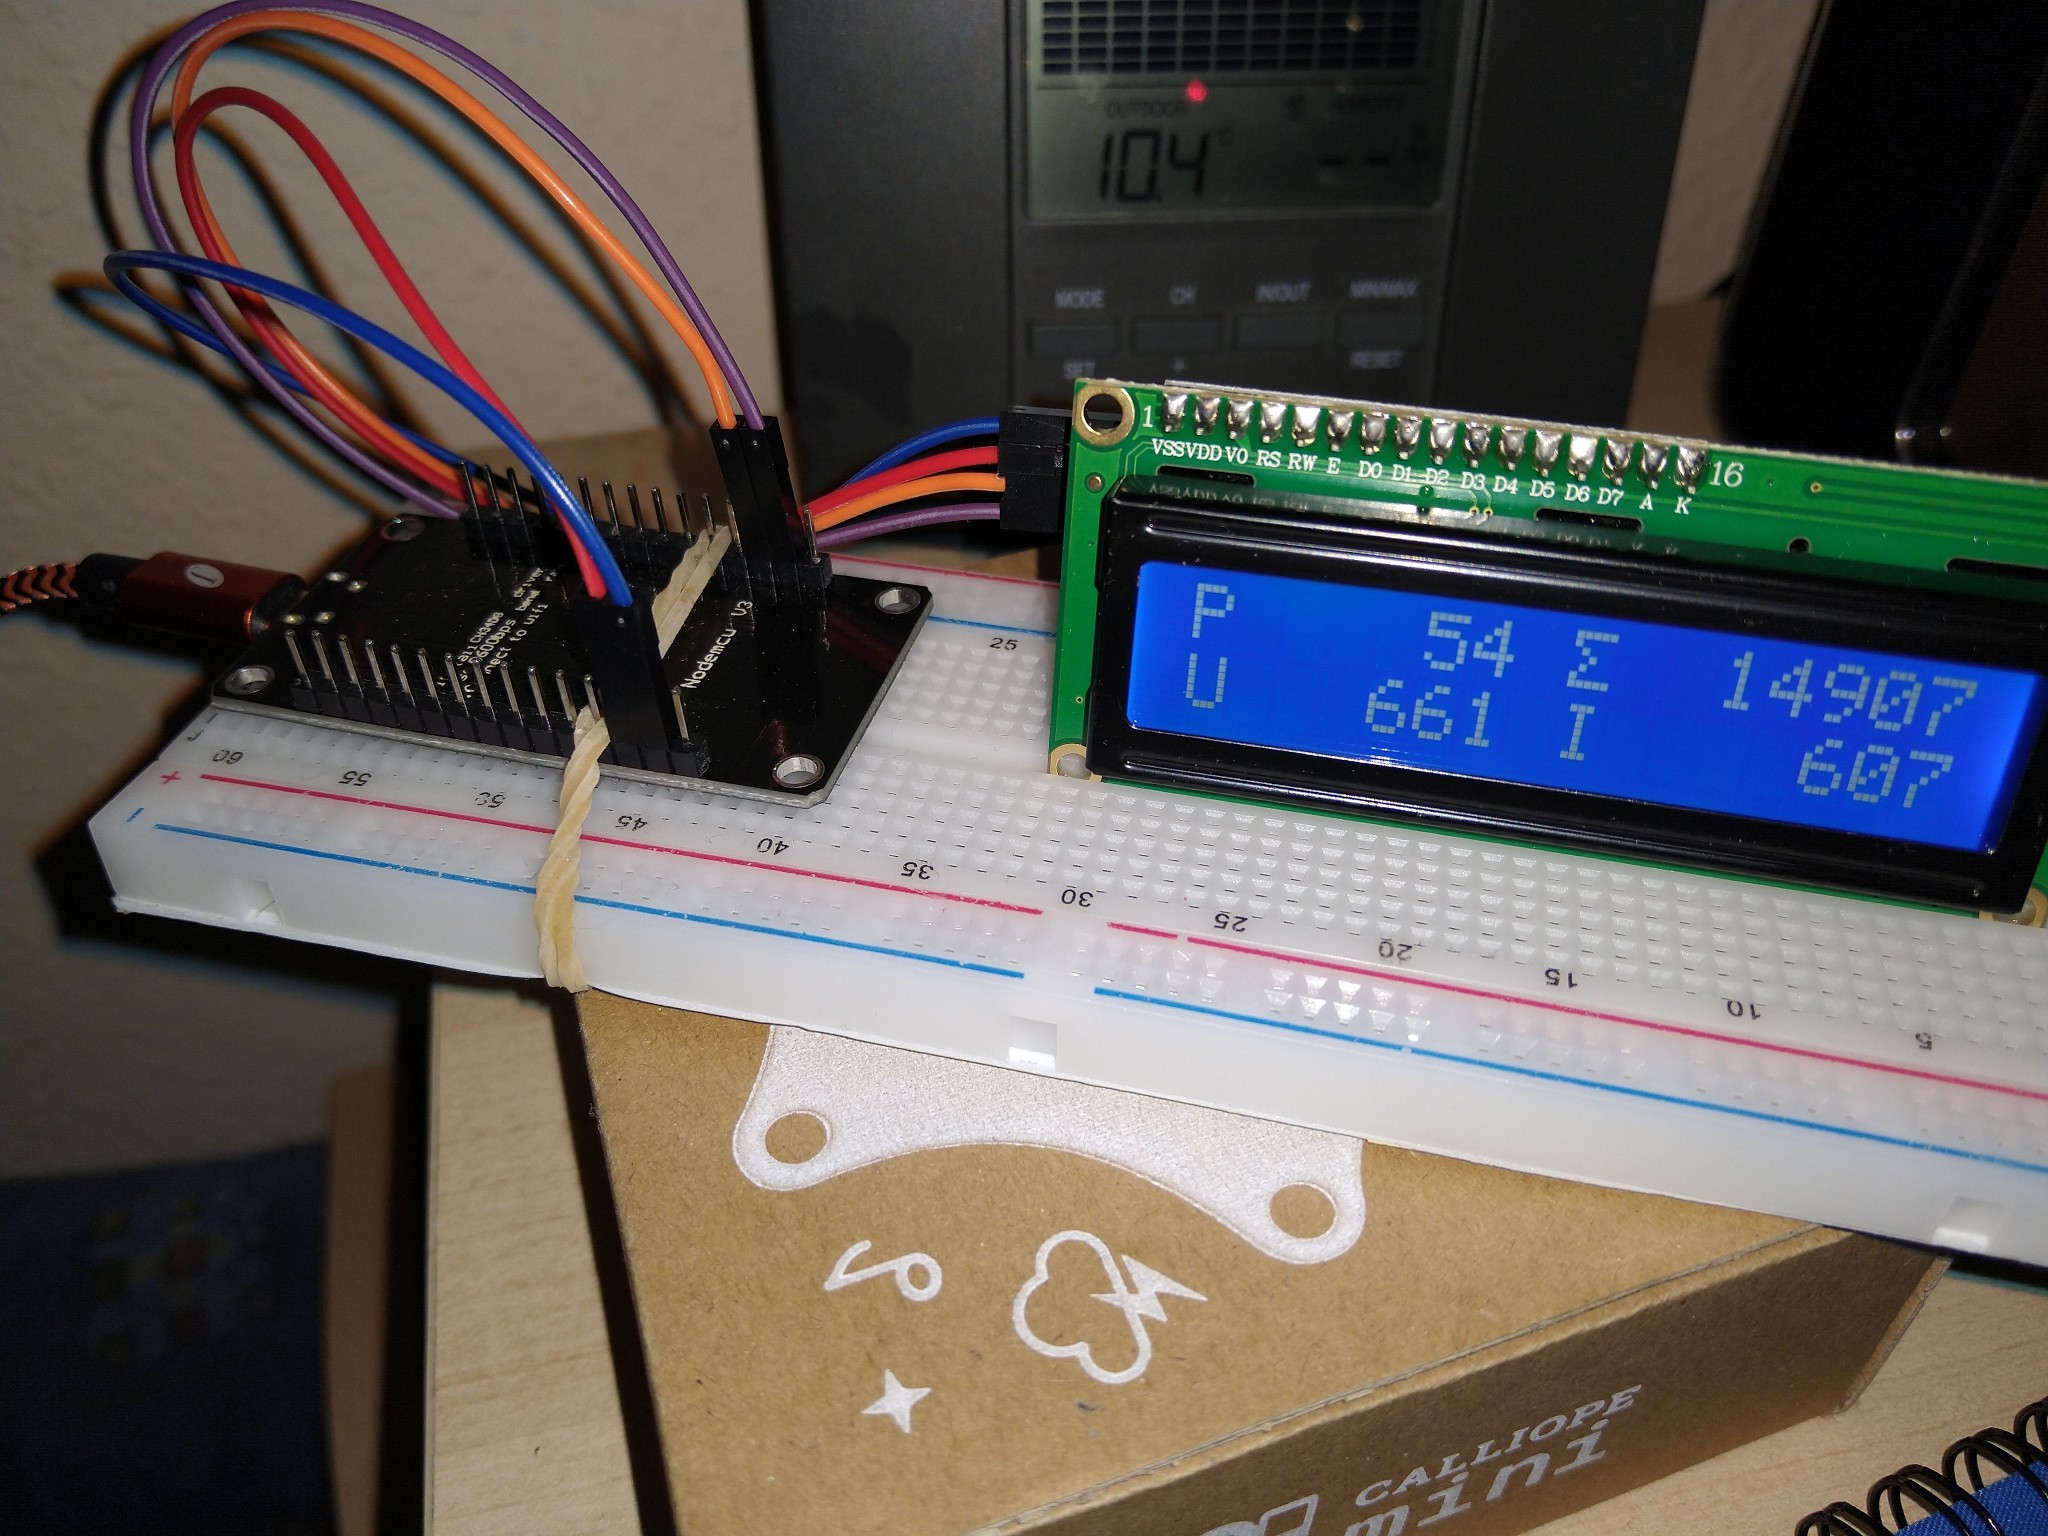
Anzeige mit Mikrocontroller NodeMCU
#include <Wire.h>

#include <hd44780.h>
#include <hd44780ioClass/hd44780_I2Cexp.h> // include i/o class heade

#include <ESP8266WiFi.h>
#include <ESP8266HTTPClient.h>

#include <ArduinoJson.h>

hd44780_I2Cexp lcd; // declare lcd object: auto locate & config display for hd44780 chip

const char* ssid = "WLAN_SCHLUESSEL";
const char* password =  "WLAN_PASSWORT";
WiFiClient wifiClient;

byte Sigma[] = {
  B11111,
  B10000,
  B01000,
  B00100,
  B01000,
  B10000,
  B11111,
  B00000
};

boolean debug = false;

void setup() {
  // put your setup code here, to run once:
  lcd.begin(16, 2);
  lcd.init();
  lcd.backlight();
  lcd.createChar(0, Sigma);
  if (debug) {
    Serial.begin(115200);
  }
  delay(4000);   //Delay needed before calling the WiFi.begin
  WiFi.begin(ssid, password);

  while (WiFi.status() != WL_CONNECTED) { //Check for the connection
    delay(1000);
    if (debug) {
      Serial.println("Connecting to WiFi..");
    }
  }

  if (debug) {
    Serial.println("Connected to the WiFi network");
  }
}

void loop() {

  DynamicJsonDocument doc(128);
  String pvData;
  if (WiFi.status() == WL_CONNECTED) { //Check WiFi connection status

    HTTPClient http;

    http.begin(wifiClient, "http://IP-HAUSINTERNER-WEBSERVER/sensors/get_pv_data.php");
    int httpResponseCode = http.GET();
    pvData = http.getString();
    if (httpResponseCode > 0) {
      if (debug) {
        Serial.print("HTTP Response code: ");
        Serial.println(httpResponseCode);
        Serial.println(pvData);
      }
    }
    else {
      if (debug) {
        Serial.print("Error code: ");
        Serial.println(httpResponseCode);
      }
    }
    http.end();  //Free resources
    //
  } else {
    if (debug) {Serial.println("Error in WiFi connection");}
  }
  deserializeJson(doc, pvData);

  String pv = String(doc["pv"]);
  while (pv.length() < 5) {
    pv = " " + pv;
  }
  String sum = String(doc["sum"]);
  while (sum.length() < 6) {
    sum = " " + sum;
  }
  String use = String(doc["use"]);
  while (use.length() < 6) {
    use = " " + use;
  }
  String netValue;
  String in = doc["in"];
  String out = doc["out"];
  if (in == "0") {
    while (out.length() < 6) {
      out = " " + out;
    }
    netValue = "O " + out;
  }
  else {
    while (in.length() < 6) {
      in = " " + in;
    }
    netValue = "I " + in;
  }

  lcd.clear();
  lcd.setCursor(0, 0);
  lcd.print("P");
  lcd.setCursor(2, 0);
  lcd.print(pv);
  lcd.setCursor(8, 0);
  lcd.write(0);
  lcd.print(" " + sum);
  lcd.setCursor(0, 1);
  lcd.print("U");
  lcd.setCursor(1, 1);
  lcd.print(use);
  lcd.setCursor(8, 1);
  lcd.print(netValue);
  delay(1000);
}
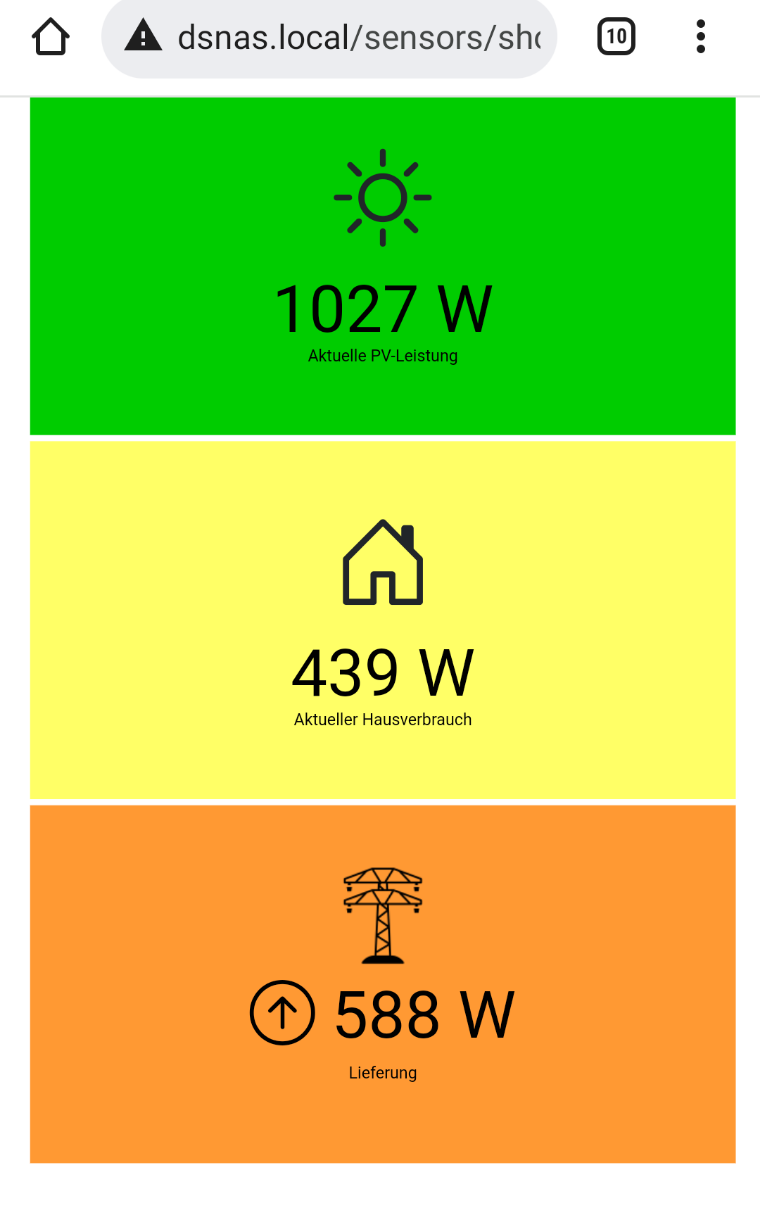
Interne Webseite
Natürlich bietet SMA neben einer App und einer Website alle Möglichkeiten die man braucht. Trotzdem habe ich nebenbei diese möglichst einfache Anzeige erstellt, für die man auf die Schnelle und ohne Login die wichtigsten Live-Daten sieht.
<!DOCTYPE html>
<html>
<head>
<script src="https://ajax.googleapis.com/ajax/libs/jquery/1.12.4/jquery.min.js"></script>
<link href="https://cdn.jsdelivr.net/npm/bootstrap@5.1.3/dist/css/bootstrap.min.css" rel="stylesheet" integrity="sha384-1BmE4kWBq78iYhFldvKuhfTAU6auU8tT94WrHftjDbrCEXSU1oBoqyl2QvZ6jIW3" crossorigin="anonymous">
<script src="https://cdn.jsdelivr.net/npm/bootstrap@5.1.3/dist/js/bootstrap.bundle.min.js" integrity="sha384-ka7Sk0Gln4gmtz2MlQnikT1wXgYsOg+OMhuP+IlRH9sENBO0LRn5q+8nbTov4+1p" crossorigin="anonymous"></script>
<link rel="stylesheet" href="https://cdn.jsdelivr.net/npm/bootstrap-icons@1.8.1/font/bootstrap-icons.css">
<style>
section.cms-boxes .cms-boxes-outer {
	text-align: left;
	margin-bottom: 6px;
	padding: 0 3px;
}

section.cms-boxes .cms-boxes-outer .cms-boxes-items {
	height: 350px;
	display: table;
	width: 100%;
}

section.cms-boxes .cms-boxes-outer .cms-boxes-items p {
	color: #000;
}

section.cms-boxes .cms-leistung {
	background-color: #00cc00;
}

section.cms-boxes .boxes-align {
	display: table-cell;
	vertical-align: middle;
}

section.cms-boxes .small-box,section.cms-boxes .large-box {
	max-width: 350px;
	margin: 0 auto;
	text-align: center;
}

section.cms-boxes .cms-boxes-items h2 {
	font-size: 4em;
	color: #000;
	font-weight: 400;
	line-height: 37px;
	text-align: center;
	margin: 15px 0 15px;
	text-transform: uppercase;
}

section.cms-boxes .cms-security {
	background-color: #0489b7;
}

section.cms-boxes .cms-grid,section.cms-boxes .cms-documentation {
	background-color: #ff9933;
}

section.cms-boxes .cms-haus,section.cms-boxes .cms-documentation {
	background-color: #ffff66;
}

</style>
<meta charset="ISO-8859-1">
<title>BS10 - PV-Data</title>
</head>
<body>

	<div class="container">
		<section class="cms-boxes">
			<div class="container-fluid">
				<div class="row">
					<div class="col-md-12 cms-boxes-outer">
						<div class="cms-boxes-items cms-leistung">
							<div class="boxes-align">
								<div class="small-box">
									<i class="bi bi-sun" style="font-size: 6em;"></i>
									<h2><span  id="leistung"></span> W</h2>
									<p>Aktuelle PV-Leistung</p>
								</div>
							</div>
						</div>
					</div>
					<div class="col-md-12 cms-boxes-outer">
						<div class="cms-boxes-items cms-haus">
							<div class="boxes-align">
								<div class="small-box">
									<i class="bi bi-house-door" style="font-size: 6em;"></i>
									<h2>
										<span id="haus"></span> W
									</h2>
									<p>Aktueller Hausverbrauch</p>
								</div>
							</div>
						</div>
					</div>
					<div class="col-md-12 cms-boxes-outer">
						<div class="cms-boxes-items cms-grid">
							<div class="boxes-align">
								<div class="small-box">
									<img src="img/icons8-electricity-96.png" width=96 />
									<h2>
										<span id="grid"></span> W
									</h2>
									<p>Lieferung</p>
								</div>
							</div>
						</div>
					</div>
				</div>
			</div>
		</section>
	</div>


	<script>

	$( document ).ready(function() {

	    readData();
	});
function readData() {
  var pvData = "http://dsnas.local/sensors/get_pv_data.php";
  $.getJSON( pvData, {})
    .done(function( data ) {
        $( "#leistung" ).text(data.pv );
        $( "#haus" ).text(data.use );
        if (data.out>0) {
        	$( "#grid" ).html("<i class=\"bi bi-arrow-up-circle\"></i> " + data.out );
        } else {
        	$( "#grid" ).html("<i class=\"bi bi-arrow-down-circle\"></i> " + data.in );
        }
      });
  setTimeout(readData, 5000);
};
</script>

</body>
</html>
Raspi-Anzeige
Das Python-Script hier zeigt nicht nur die PV-Daten an, sondern auch Daten des selbst gebauten Gaszählers.
#!/usr/bin/env python
# coding=utf-8

# Bibliotheken importieren
import lcddriver
import time
import datetime
import requests
import json

lcd = lcddriver.lcd()
lcd.lcd_clear()


while 1==1:


	try:
		r = requests.get("http://IP-HAUSINTERNER-WEBSERVER/sensors/get_pv_data.php", verify=False)
	except Exception:
		pass

	result = r.json()

	actPower    = result["pv"]
	actToGrid   = result["out"]
	actFromGrid = result["in"]
	actZaehler  = result["sum"]
	actUse      = result["use"]

	if actPower is None:
		actPower = 0

	actPowerStr   = str(actPower)
	actZaehlerStr = str(actZaehler)
	actUseStr     = str(actUse)
	actToGridStr  = str(actToGrid)
	actFromGridStr= str(actFromGrid)

	while len(actPowerStr) < 5:
		actPowerStr = " " + actPowerStr

	while len(actZaehlerStr) < 6:
		actZaehlerStr = " " + actZaehlerStr

	while len(actUseStr) < 6 :
		actUseStr = " " + actUseStr
	while len(actToGridStr) < 5:
		actToGridStr = " " + actToGridStr
	while len(actFromGridStr) < 5 :
		actFromGridStr = " " + actFromGridStr

	if actFromGrid == 0 :
		netValue = "O " + actToGridStr
	else :
		netValue = "I " + actFromGridStr

	try:

		r = requests.get("http://IP-HAUSINTERNER-WEBSERVER/sensors/get_gasmeter.php", verify=False)
	except Exception:
		pass

	result = r.json()

	if result is not None :
		seconds = int(result["seconds"])
		last_ping = int(result["last_ping"])
		if result["sum"] is not None :
			sum_day = float(result["sum"])/100.0
		else:
			sum_day = 0
	else :
		seconds = 0;
		last_ping = 0;

	now = int(time.time())
	t_diff = now-last_ping

	if t_diff>seconds :
		seconds=t_diff


	verbrauchStr = str(round(36.0/float(seconds),3))


	# Ausgaben auf Display schreiben
	lcd.lcd_clear()
	lcd.lcd_display_string("P " + actPowerStr + " W S" + actZaehlerStr + " Wh", 1)
	lcd.lcd_display_string("U" + actUseStr   + " W " + netValue + " W",2)
	lcd.lcd_display_string("Gas heute: " + str(sum_day) + " m3",3)
	lcd.lcd_display_string("Gas " + verbrauchStr + " m3/h " + str(t_diff),4)
	time.sleep(1.5)

else:
	lcd.lcd_display_string("bye",1)